Making vendor sustainability data usable for your reporting


Key Takeaways
- Scope 3 emissions run on average 11 times higher than direct operational emissions. Most facility and vendor relationships fall squarely in that category, meaning the facility service providers are a major share of a client’s reported footprint.
- Visibility is the real bottleneck, not willingness. 70% of chief procurement officers didn't know where their own Scope 3 emissions originated in their value chain, and 90% struggled to identify the right actions.
- Granularity separates defensible datafrom guesswork. A vendor offering only spend-based estimates hands over theleast accurate category available, while activity-based, site-specific datadoes the work a client's own team would otherwise have to absorb.
Transcript
Sustainability in the building industry has been under renewed scrutiny in recent years. Buildings account for nearly 40% of global energy-related carbon emissions, which puts sustainability reporting near the top of the priority list for investors, regulators, tenants, and building owners alike.
The legal reporting requirements have been in flux recently, but the underlying demand for better sustainability data has not gone anywhere. In article one of this series, we looked at what it takes for a facility partner's sustainability commitments to hold up under scrutiny. This article looks at amore specific version of that question: what happens when your own reporting depends on the data your vendors give you.
What data is required, and by which regulations
“Sustainability reporting” is not a monolith. There are many regulations that mandate certainESG disclosures.
Table source: https://www.sap.com/resources/sustainability-reporting
The most prevalent frameworks for the building industry are the CSRD, California’s SB 253, and California’s SB 261.
The EU’s Corporate Sustainability Reporting Directive (CSRD) requires covered companies to report sustainability information under European standards, including climate-related information. Companies must consider both how sustainability issues could affect their financial performance and how their operations affect people and the environment.
The EU’s Omnibus I directive, which took effect in March 2026, significantly narrowed thee datapoints. The CSRD now applies primarily to companies with more than 1,000 employees and over €450 million in net annual revenue, removing an estimated 80% of companies previously covered, and reduced mandatory reporting requirements by about 61%. Companies that remain covered must continue to report Scope 1, 2, and 3 greenhouse gas emissions.
California has two climate-related reporting requirements. The Climate Corporate Data Accountability Act(SB 253) requires companies with more than $1 billion in annual revenue doing business in California to disclose Scope 1, 2, and 3 emissions in conformance with the GHG Protocol, including third-party assurance. The Climate-RelatedFinancial Risk Act (SB 261) asks companies with more than $500 million in revenue to disclose climate-related financial risks aligned with theTCFD framework, biennially, rather than requiring an emissions inventory.
Even where a company is not legally required to report, there is plenty of incentive to collect better sustainability data.
Why this data matter snow, not just eventually
Scope 3 emissions are the indirect emissions that come from a company’s value chain, rather than inside its own operations. Scope 3 emissions account for the majority of a company’s total carbon footprint; by some estimates, these emissions are on average 11 times higher than direct operational emissions.
Facility services vendors sit squarely inside that Scope 3 category. “Each company has its own Scope 1, 2, and 3,” says Graham Moxon, who leads customer-facing sustainability solutions for ABM in theUK and Ireland. “But from our customers’ point of view, we sit inside their Scope 3. It’s typically the biggest category, and also the biggest challenge, because it covers their entire supply chain.”
Scope 3 emissions include purchased goods and services, the category that includes most facility services and vendor relationships. That means a facility can have excellent visibility into its own energy use and fleet emissions and still be missing the largest share of what regulators, investors, and increasingly customers want to see.
The regulatory pressure to close that gap is real, even if the specific rules have been unusually unstable over the past two years. Yet, most facilities do not have the infrastructure in place to collectScope 3 emissions data efficiently or accurately.
Why getting data from vendors is genuinely hard
Today, 40% of companies track their Scope 1 and 2 emissions. Far fewer are equipped to track their Scope 3 emissions.
According to the 2025 State of Supply Chain Sustainability Report, a lack of supplier data is the single most-cited barrier to Scope 3 reporting.
Part of the problem is that most companies use spread sheets in some form to track Scope 3 emissions. Heavy reliance on spreadsheets raises concerns about data accuracy and scalability. Facility-level energy and consumption data make tracking even more complicated. Buildings generate data from smart meters, HVAC controls, lighting systems, and submeters. Without the right tools, that data stays fragmented across disconnected systems or spreadsheets, rather than feeding into a usable, centralized view.
“The real challenge is that systems aren’t connected,” Moxon says. “A lot of the work is just tracing:okay, that data comes from that system, that comes from that other system.”
The stakes of getting this wrong are not abstract. Research estimates that inaccurate or unmanaged upstream Scope 3 data represents a risk worth more than $500 billion annually by 2030, spanning regulatory penalties, missed pricing premiums, and investor skepticism.
Vendors are willing to share data. But, in many cases, the underlying systems were never built to produce shareable, granular data in the first place. A vendor relying on a monthly utility bill or an annual manual survey can tell a client what was spent or roughly what was used. A vendor with real-time, equipment-level monitoring can tell a client which system, which shift, or which site actually drove a given number, and can do it continuously.
Moxon describes the shift this data enables as a move away from marketing claims and toward evidence. For example, cleaning products: “The traditional way the industry promoted sustainable solutions was, ‘we’ve got a green bottle, a green name, it’s fantastic’,” he says. “In most cases, that’s just marketing. In the UK&I, we have invested heavily and leveraged our relationships with suppliers to tell you exactly how much emissions come from each activity, each bottle, each delivery run. That level of detail gives our clients confidence that the data isn’t marketing. It’s evidential.”
The cost of not reporting
Most conversations about the cost of sustainability reporting focus on the price of building compliance systems. That framing misses the more important number: what it costs when a facility does not invest, and has to make up the reporting gap under pressure instead.
Regulatory penalties are real, if still evolving. Companies that fail to comply with CSRD can face fines of up to €10 million or 5% of annual revenue. SB 253 in California authorizes penalties of up to $500,000 per entity per year for non-filing or compliance failures.
The intangible costs compound. McKinsey's research found that 70% of chief procurement officers said their organizations didn't understand where their own Scope 3 emissions were even generated in their value chain. 90% had difficulty identifying the right actions to take as a result. That's a visibility problem before it's a reporting problem, and it tends to show up as slower deal cycles and more time spent chasing vendors manually.
Reputational exposure runs in the same direction:facilities increasingly treat incomplete ESG data as a trust problem, not just a paperwork gap. Organizations relying on fragmented, manual processes carry ongoing risk of investor backlash and operational disruption.
These risks have shifted the conversation among facility and infrastructure leaders from reporting to operations, treating sustainability data as something a building or a service relationship produces continuously as a byproduct of how it runs, rather than something reconstructed once a year for a filing deadline.
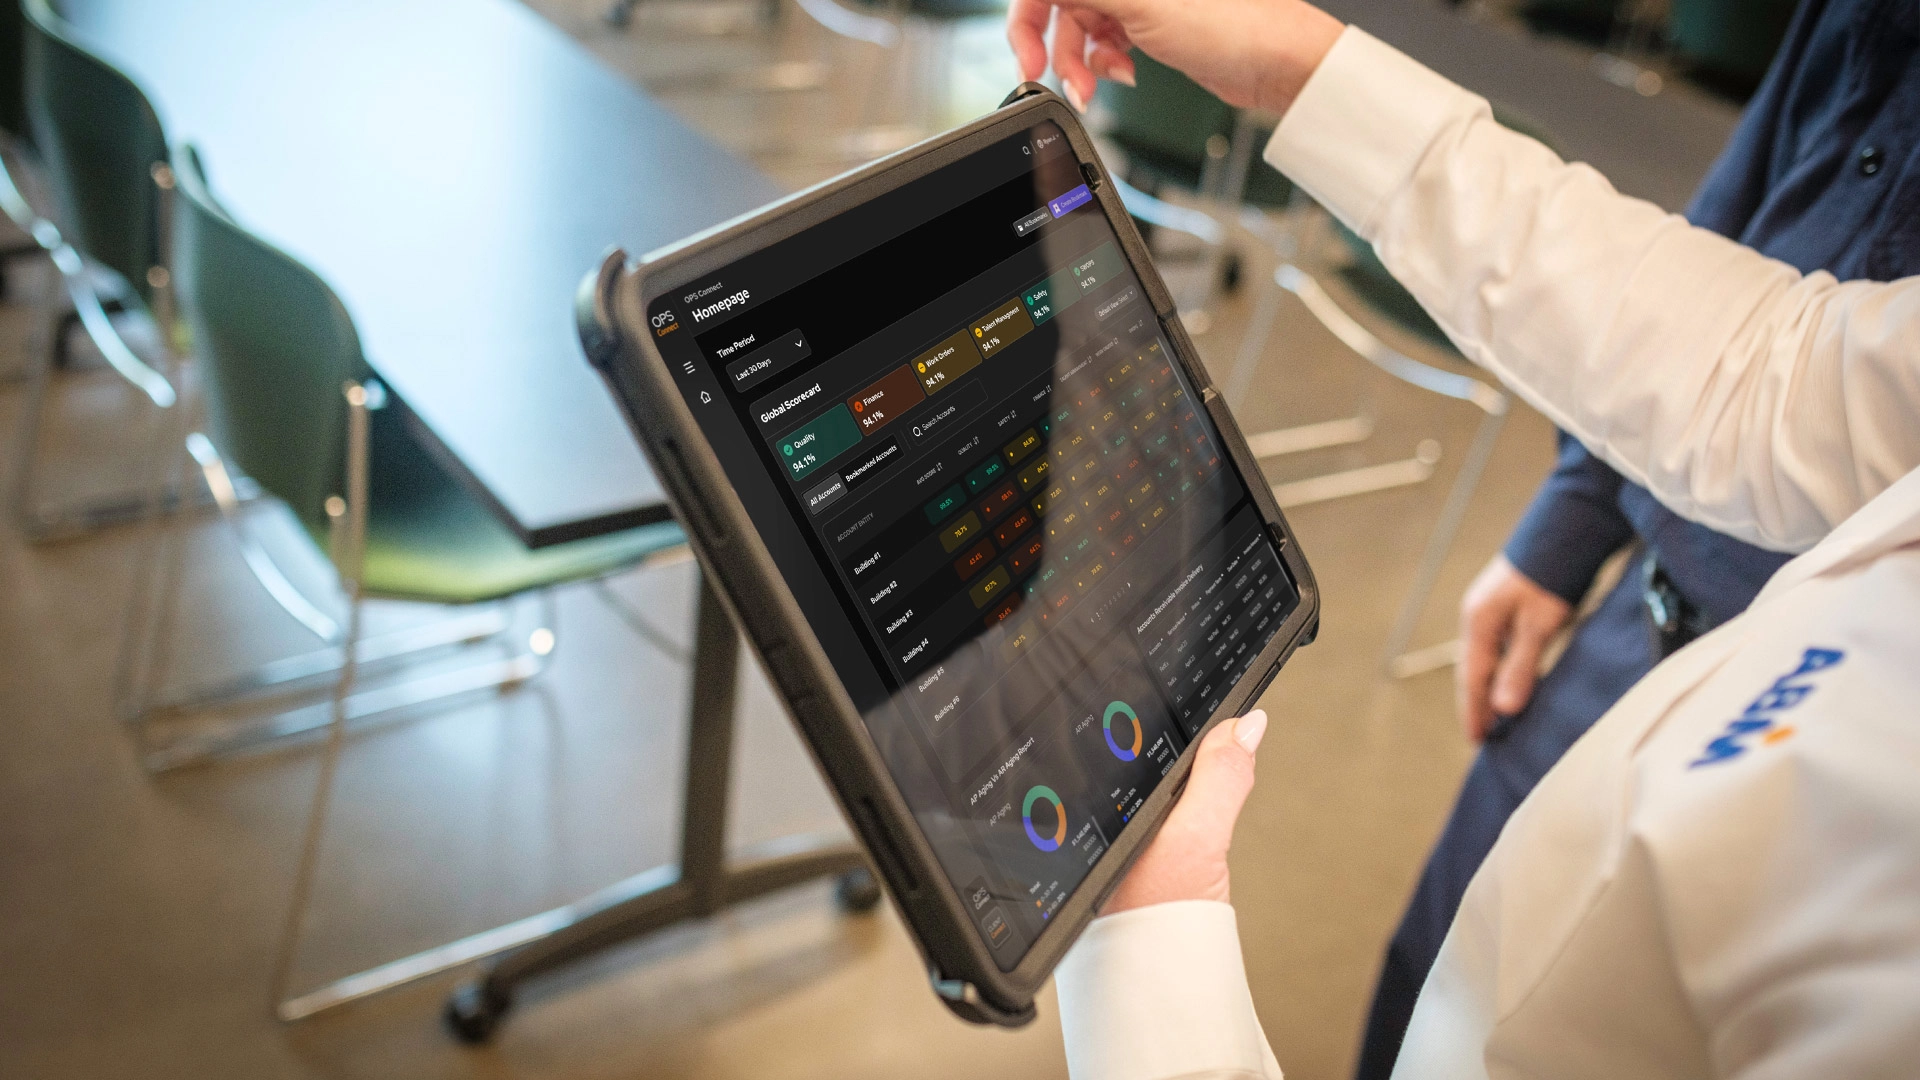
ABM Connect illustrates what that looks like in practice. Rather than relying on annual vendor questionnaires or reconstructed utility bills, the platform brings together real-time facility, financial, equipment, IoT, and service delivery data into a single operational view
A major airport terminal in the Northeast U.S. used that real-time visibility to improve service delivery and energy efficiency performance across its complex facility operations. The site reached ROI in four months, agains tan original six-to-nine-month estimate, identifying close to $170,000 in energy savings with more than $60,000 in additional savings found.
Enhanced data reporting is also showing up at the contract level, not just the platform level. In the U.K. and Ireland, ABM has rolled out account-level carbon reporting to 23 contracts last year, providing detailed Scope 1, 2, and 3 assessments based on ABM’s activities on said contract. In most cases extend down to product-level emissions rather than stopping at a site-wide estimate. That granularity fed 122 sustainability initiatives tailored to the specific needs of 21 individual contracts, the kind of specificity a single annual vendor number simply cannot support.
The same discipline applies to how the data itself is produced and checked. ABM's own emissions accounting documents a restated base year and an expanded set of Scope 3 categories. This level of transparency is the only way a client can judge whether the underlying data would hold up under an auditor's scrutiny. The materiality assessment behind that reporting is conducted by a third party, not assembled internally, and is aligned to GRI, TCFD, and SASB standards, incorporating input from clients, vendors, and investor-focused rating agencies rather than being set unilaterally.
The takeaway for facility and infrastructure decisions
Given how much of a typical company's footprint sits in Scope 3, the vendors handling facility services, engineering, and infrastructure work arenot a minor part of sustainability reporting.
Client demand for detailed Scope 3 data is still emerging rather than universal, but it’s no longer hypothetical. Clients in the U.K. and Ireland have asked ABM directly for emissions data on their accounts. In both cases ABM was able to provide it immediately because the underlying tracking was already in place. “We’re ahead of the market in having this tool available before asked in the U.K. and Ireland right now, but demand is starting to creep in,” Moxon says.“It’s going to become the obvious expectation: giving customers a full footprint of our activities and a solution to support.”
A vendor that can only provide spend-based, business-wide estimates is handing over the least accurate, least defensible category of data available.
Accurate, timely vendor data closes the reporting gap. It doesn't close the operational one. Emissions reporting is only useful to the extent an organization can act on what it shows. For mission-critical facilities, that action runs into a harder question than data quality: whether reducing a footprint is compatible with the reliability those facilities cannot compromise on.
The next article in this series looks at that question directly, using ABM's work on battery storage, microgrids, and engineered power infrastructure to show how decarbonization and uptime are increasingly built as the same system rather than traded off against each other.
Source 1: McKinsey.com Our Insights
Source 2: co2ai.com insights
Source 3: mitsloan.mit.edu ideas made to matter
Source 4: ThomsonReuters.com Posts
Source 5: PWC.com in-depth
Source 6: Dlapiper.com Knowledge
Source 7: SAP.com Resources
Source 8: ISSA.com Articles